Hi, my name is Tom Smykowski, I'm a staff full-stack engineer. I build and scale SaaS platforms to millions of users, working end-to-end from system architecture to frontend to mobile. On this blog I share what I learn about software engineering, innovative data visualization techniques, and the latest in monitoring tools.
What This Article Covers
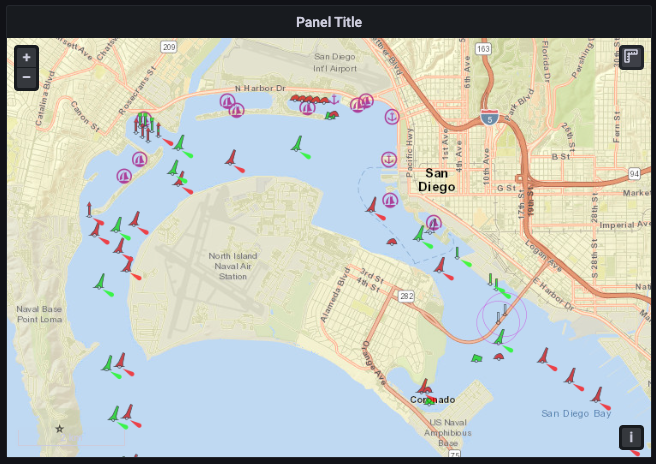
Discover the latest features introduced in Grafana 9.3, a leading monitoring tool that enhances data visualization. This article delves into the new capabilities such as geo-visualization improvements, language support expansion, and enhanced email customization that make Grafana even more powerful for developers and data scientists.
Questions This Article Answers
- What are the new geo-visualization features in Grafana 9.3?
- How does the updated navigation menu improve user experience?
- Which new languages are supported in this version of Grafana?
- How can the improved email customization benefit alert management?
- What makes Grafana 9.3 a compelling choice for monitoring dashboards?
Length and Time
A detailed exploration of Grafana 9.3's new features with practical insights. Approximately 7 minutes to read.